CO₂ Spectrum
In a steady state gas (not heating or cooling), as much power is emitted as absorbed. If a low energy photon hits an atom, it deposits a tiny bit of light pressure momentum and a very tiny bit of energy as atom kinetic energy.
Emissivity and absorption in the same band are pretty much the same value, unless power is absorbed or downshifted.
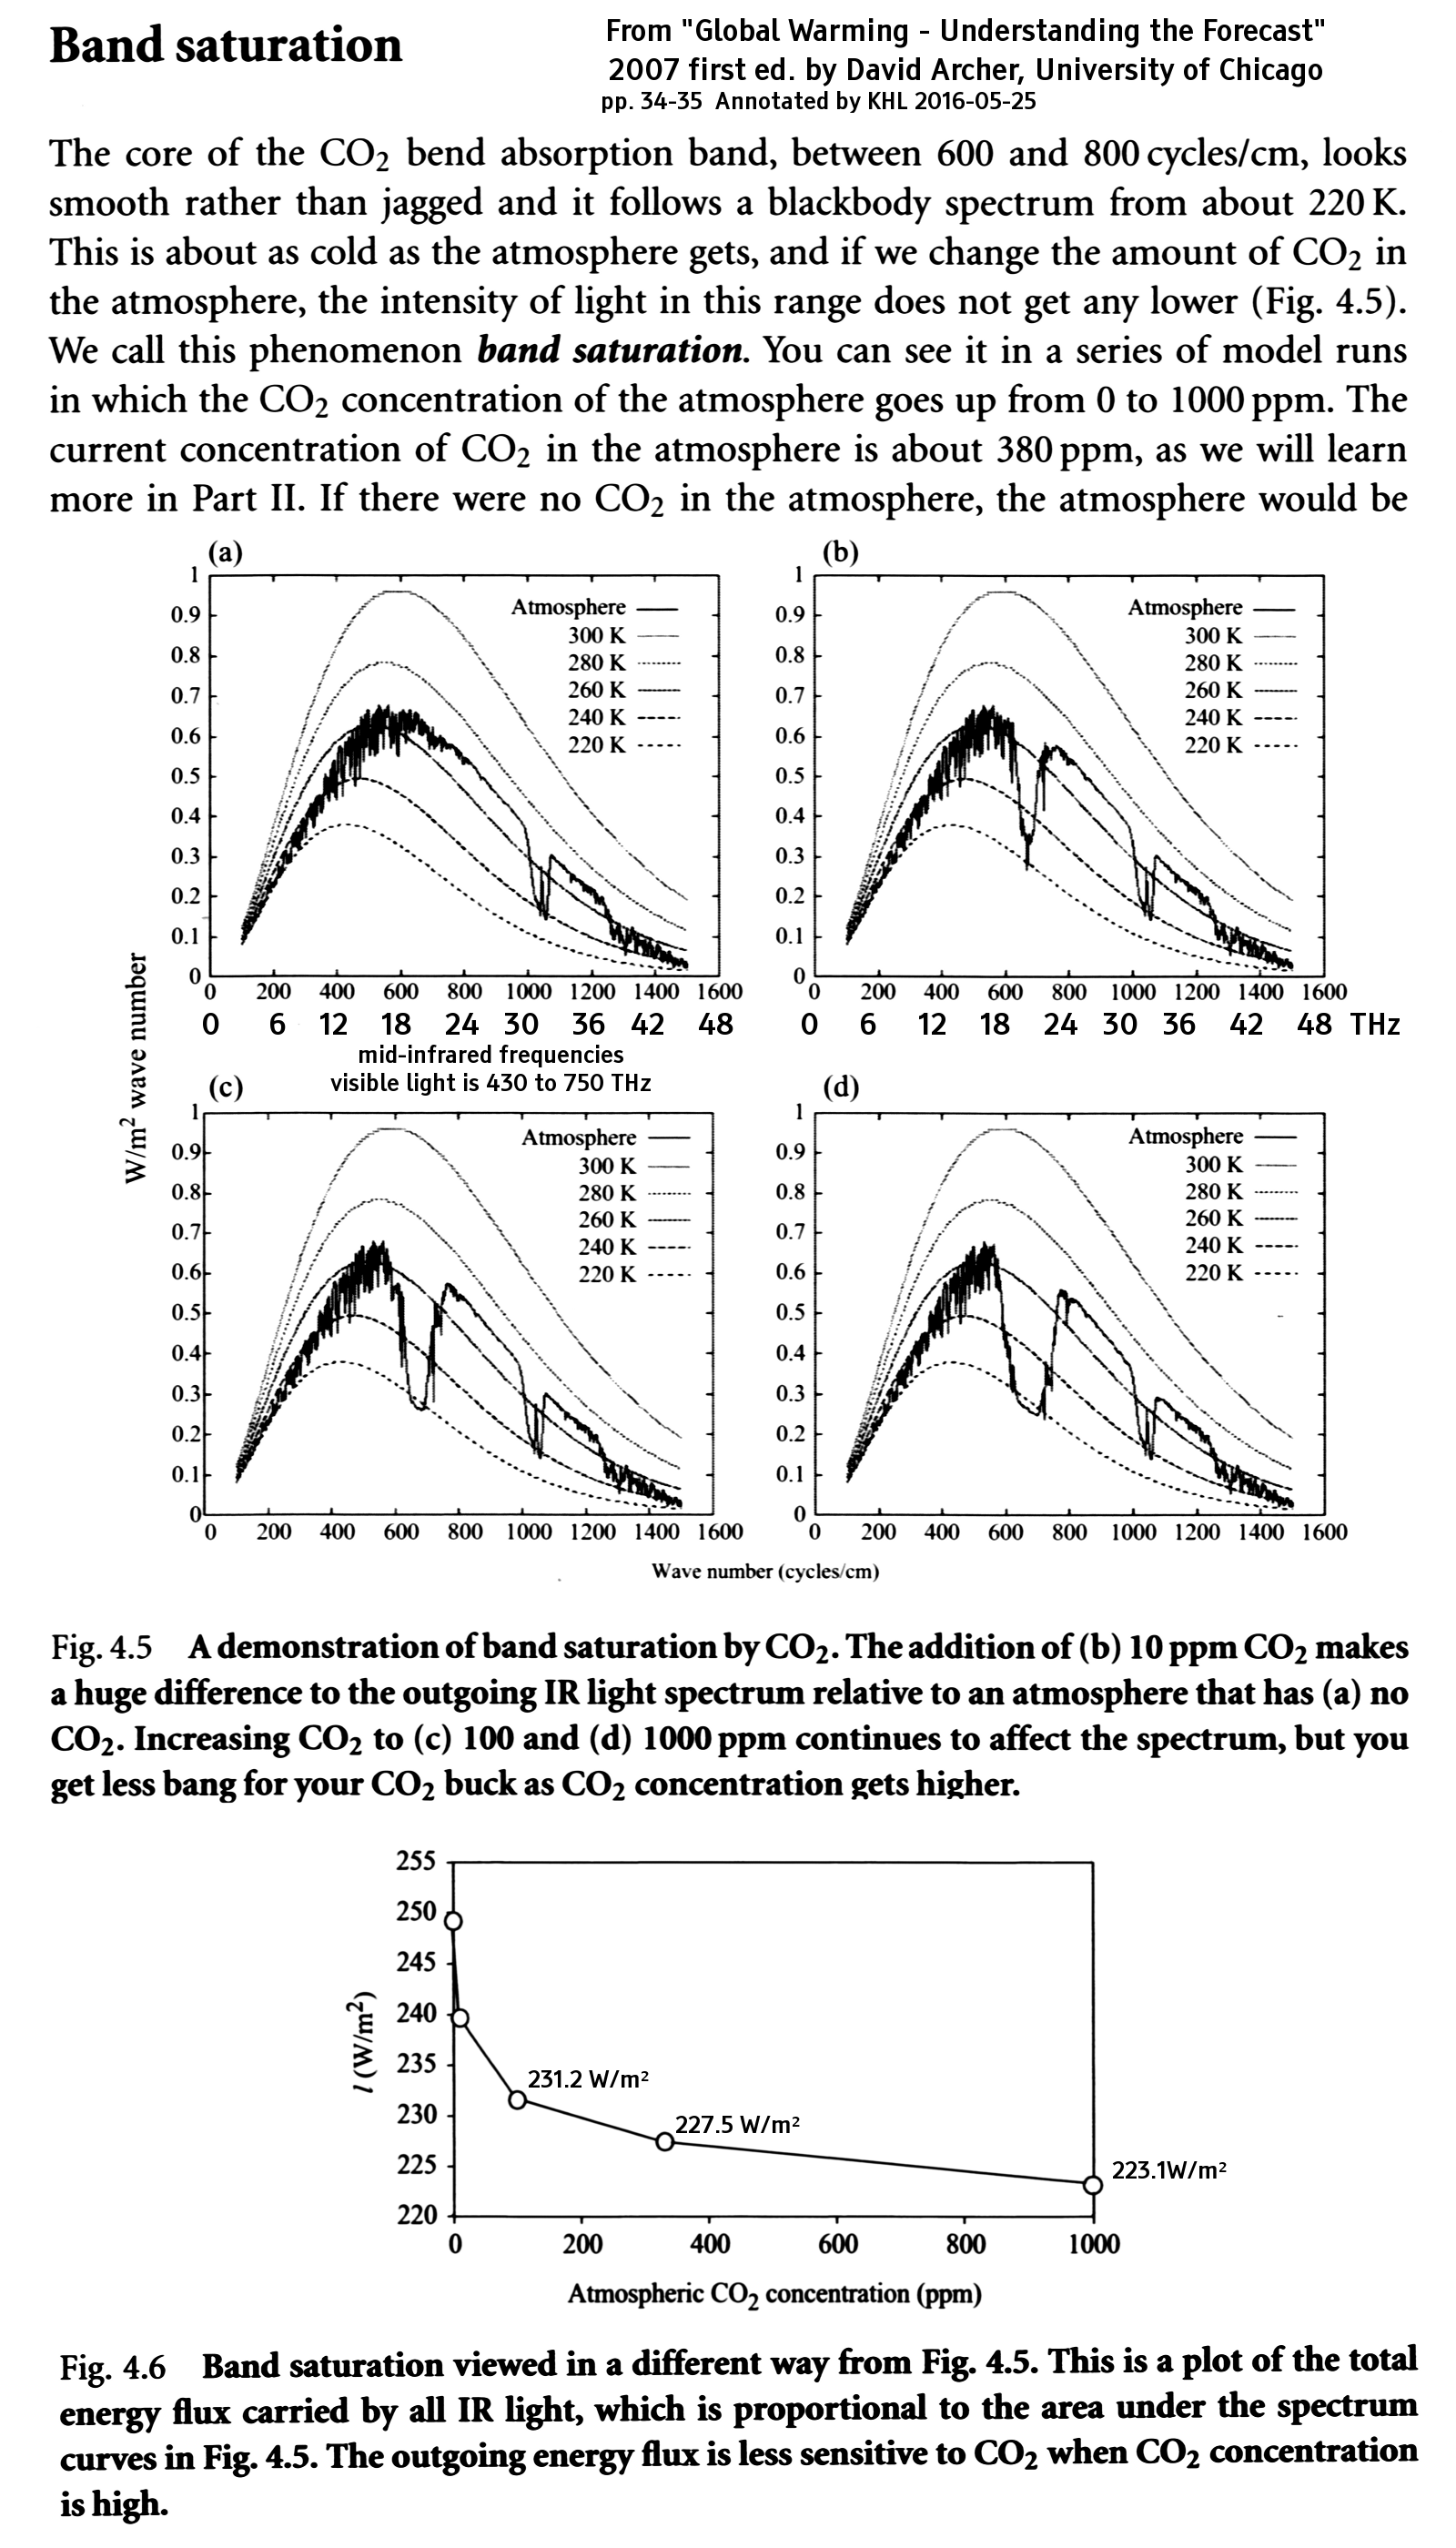
From Global Warming, Understanding The Forecast by David Archer, Blackwell 2007, without permission. Buy the book for a lucid explanation of the science; perhaps the author and publisher might forgive me for posting the excerpt below.
Cycles/cm are difficult units for an EE. The speed of light is 3e10 cm/s, so multiply 600 to 800 cycles/cm to get 18 to 24 THz.

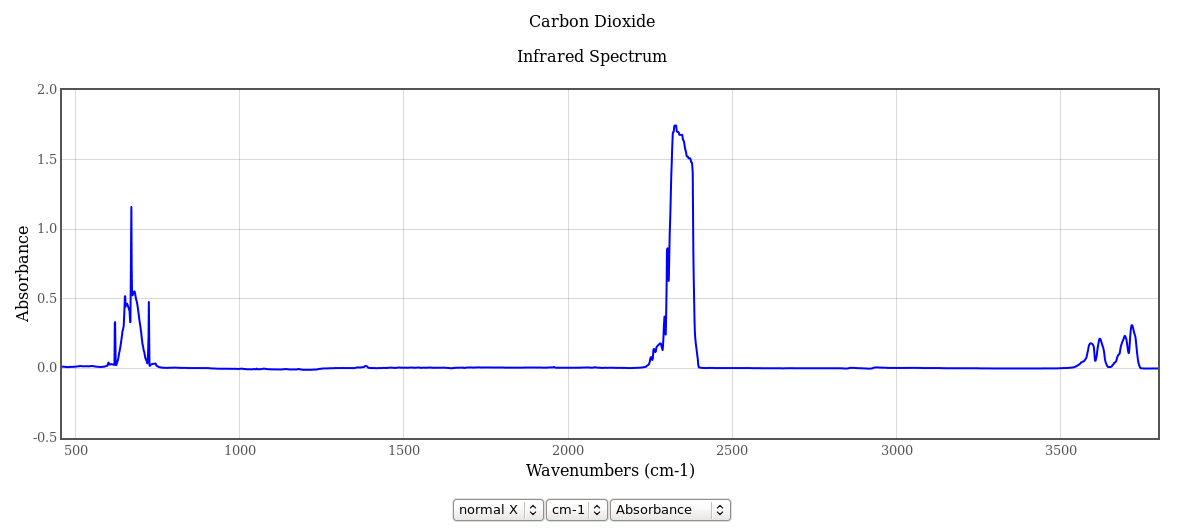
Here's the CO₂ absorbance spectrum from NIST: ( http://webbook.nist.gov/cgi/cbook.cgi?ID=C124389&Type=IR-SPEC&Index=1#IR-SPEC )

This first graph shows absorbance out to 3700 cycles/cm ( about 110 THz ).
Absorbance is the common logarithm of the incident to transmitted radiation, so an absorbance of 1.7 (like the center of the 2300 cycles/cm peak) means an attenuation by a factor of 101.7 or 50. If the gas layer is twice as dense or twice as thick as the sample measured here (see the notes for the NIST web page), the attenuation is 103.4 or 2500. If the absorbance is precisely zero, the attenuation is zero even for an infinitely thick sample.
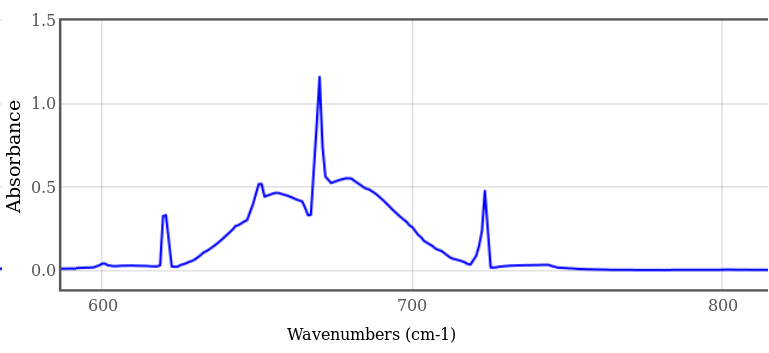
The strongest and broadest peak is at 2300 cycles/cm (about 70 THz), but this peak is irrelevant; The Earth is 220K to 300K (depending on where you look) so this is well above the earth's black body emission peaks (400 to 600 cycles/cm), in the quantum-limited exponential rolloff region. It is also well below the sun's black body emission peak of 11,300 cycles/cm at 5780 K. The peak that matters to us is within the 100 to 1500 cycles/cm window, shown below.
The sample of gas measured is 10 cm thick of 200 mmHg CO₂ in 600 mmHg N₂, temperature not specified, so presume 300K, 23C. 760 mmHg is 101.325 KPa, so the gas sample is 27 KPa of CO₂. CO₂ is 1.96 kg/m3 at STP, so adjusting for temperature ( 273/300 ) and pressure ( 200/760 ) the density of the 0.1 meter thick sample is 4.7e-2 kg/m2. At 400 ppm atmospheric concentration by weight, and 1.225 kg/m3 standard atmospheric density, the CO₂ atmospheric density is 4.9e-4 kg/m3, so this is the CO₂ density in 100 meters of sea level air, or about 400 meters of lower stratospheric air. The pressure scale height in the lower stratosphere is about 6400 meters, so multiply the first graph below by approximately 15 for a crude estimate of the column absorbance from the tropopause to space.

The interesting aspect of this peak is that it is broad, not sharp, with long tapering tails to the side. Since this is logarithmic, there is no place where the sample is perfectly absorptive; however, it is "more absorptive than transmissive" where the graph is greater than 0.3 ( approximately log(2) ). Double the thickness, double the attenuation of the tails, and more of the spectrum (after doubling) is greater than 0.3. Note how the two sharp side lobe horns match the downward-pointing horns of Archer's figures 4.4-b and 4.4-c, above.

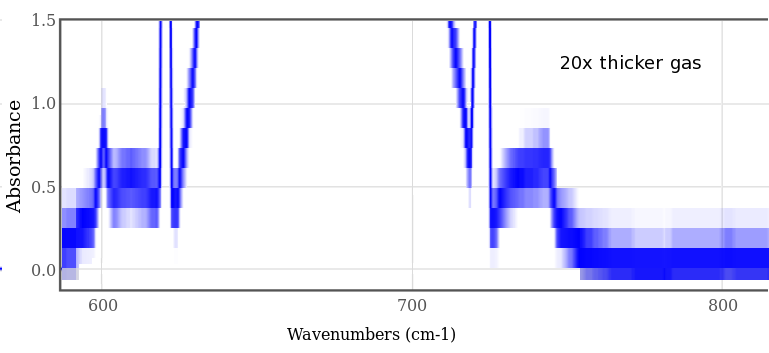
If the gas sample is 20 times thicker (or denser), even more of the spectrum is absorptive. This graph is magnified vertically with the "gimp" image editor; it would be better to replot the original data, but this shows the general idea. Note the slope is still rising beyond 600 cycles/cm and 750 cycles/cm; if the sample was 100 times or 1000 times denser, the stop band would continue to grow. Early in the earth's history, when the atmosphere had no oxygen and was mostly nitrogen and CO₂ (many percent, not 0.04%), this was the case - it kept the Earth warm when the Sun was only 80% of its current luminosity.
For comparison, here's the H₂O IR absorbance spectrum from NIST.
( http://webbook.nist.gov/cgi/cbook.cgi?ID=C7732185&Type=IR-SPEC&Index=0#IR-SPEC ). Since the website does not specify gas density or temperature, this may not be directly comparable to the CO₂ graphs above. However, what is important is that it is not absorptive over the entire relevant spectrum (100 to 1500 cycles/cm), just as the CO₂ data is not absorptive.
