|
Size: 1427
Comment:
|
Size: 1541
Comment:
|
| Deletions are marked like this. | Additions are marked like this. |
| Line 16: | Line 16: |
| This first graph shows absorption out to 3700 cycles/cm ( about 110 THz ). | This first graph shows absorptance out to 3700 cycles/cm ( about 110 THz ). |
| Line 23: | Line 23: |
| The interesting aspect of this peak is that it is broad, not sharp, with long tapering tails to the side. | The interesting aspect of this peak is that it is broad, not sharp, with long tapering tails to the side. Frankly, I do not know what the vertical scale for this graph means, since absorption cannot be greater than one |
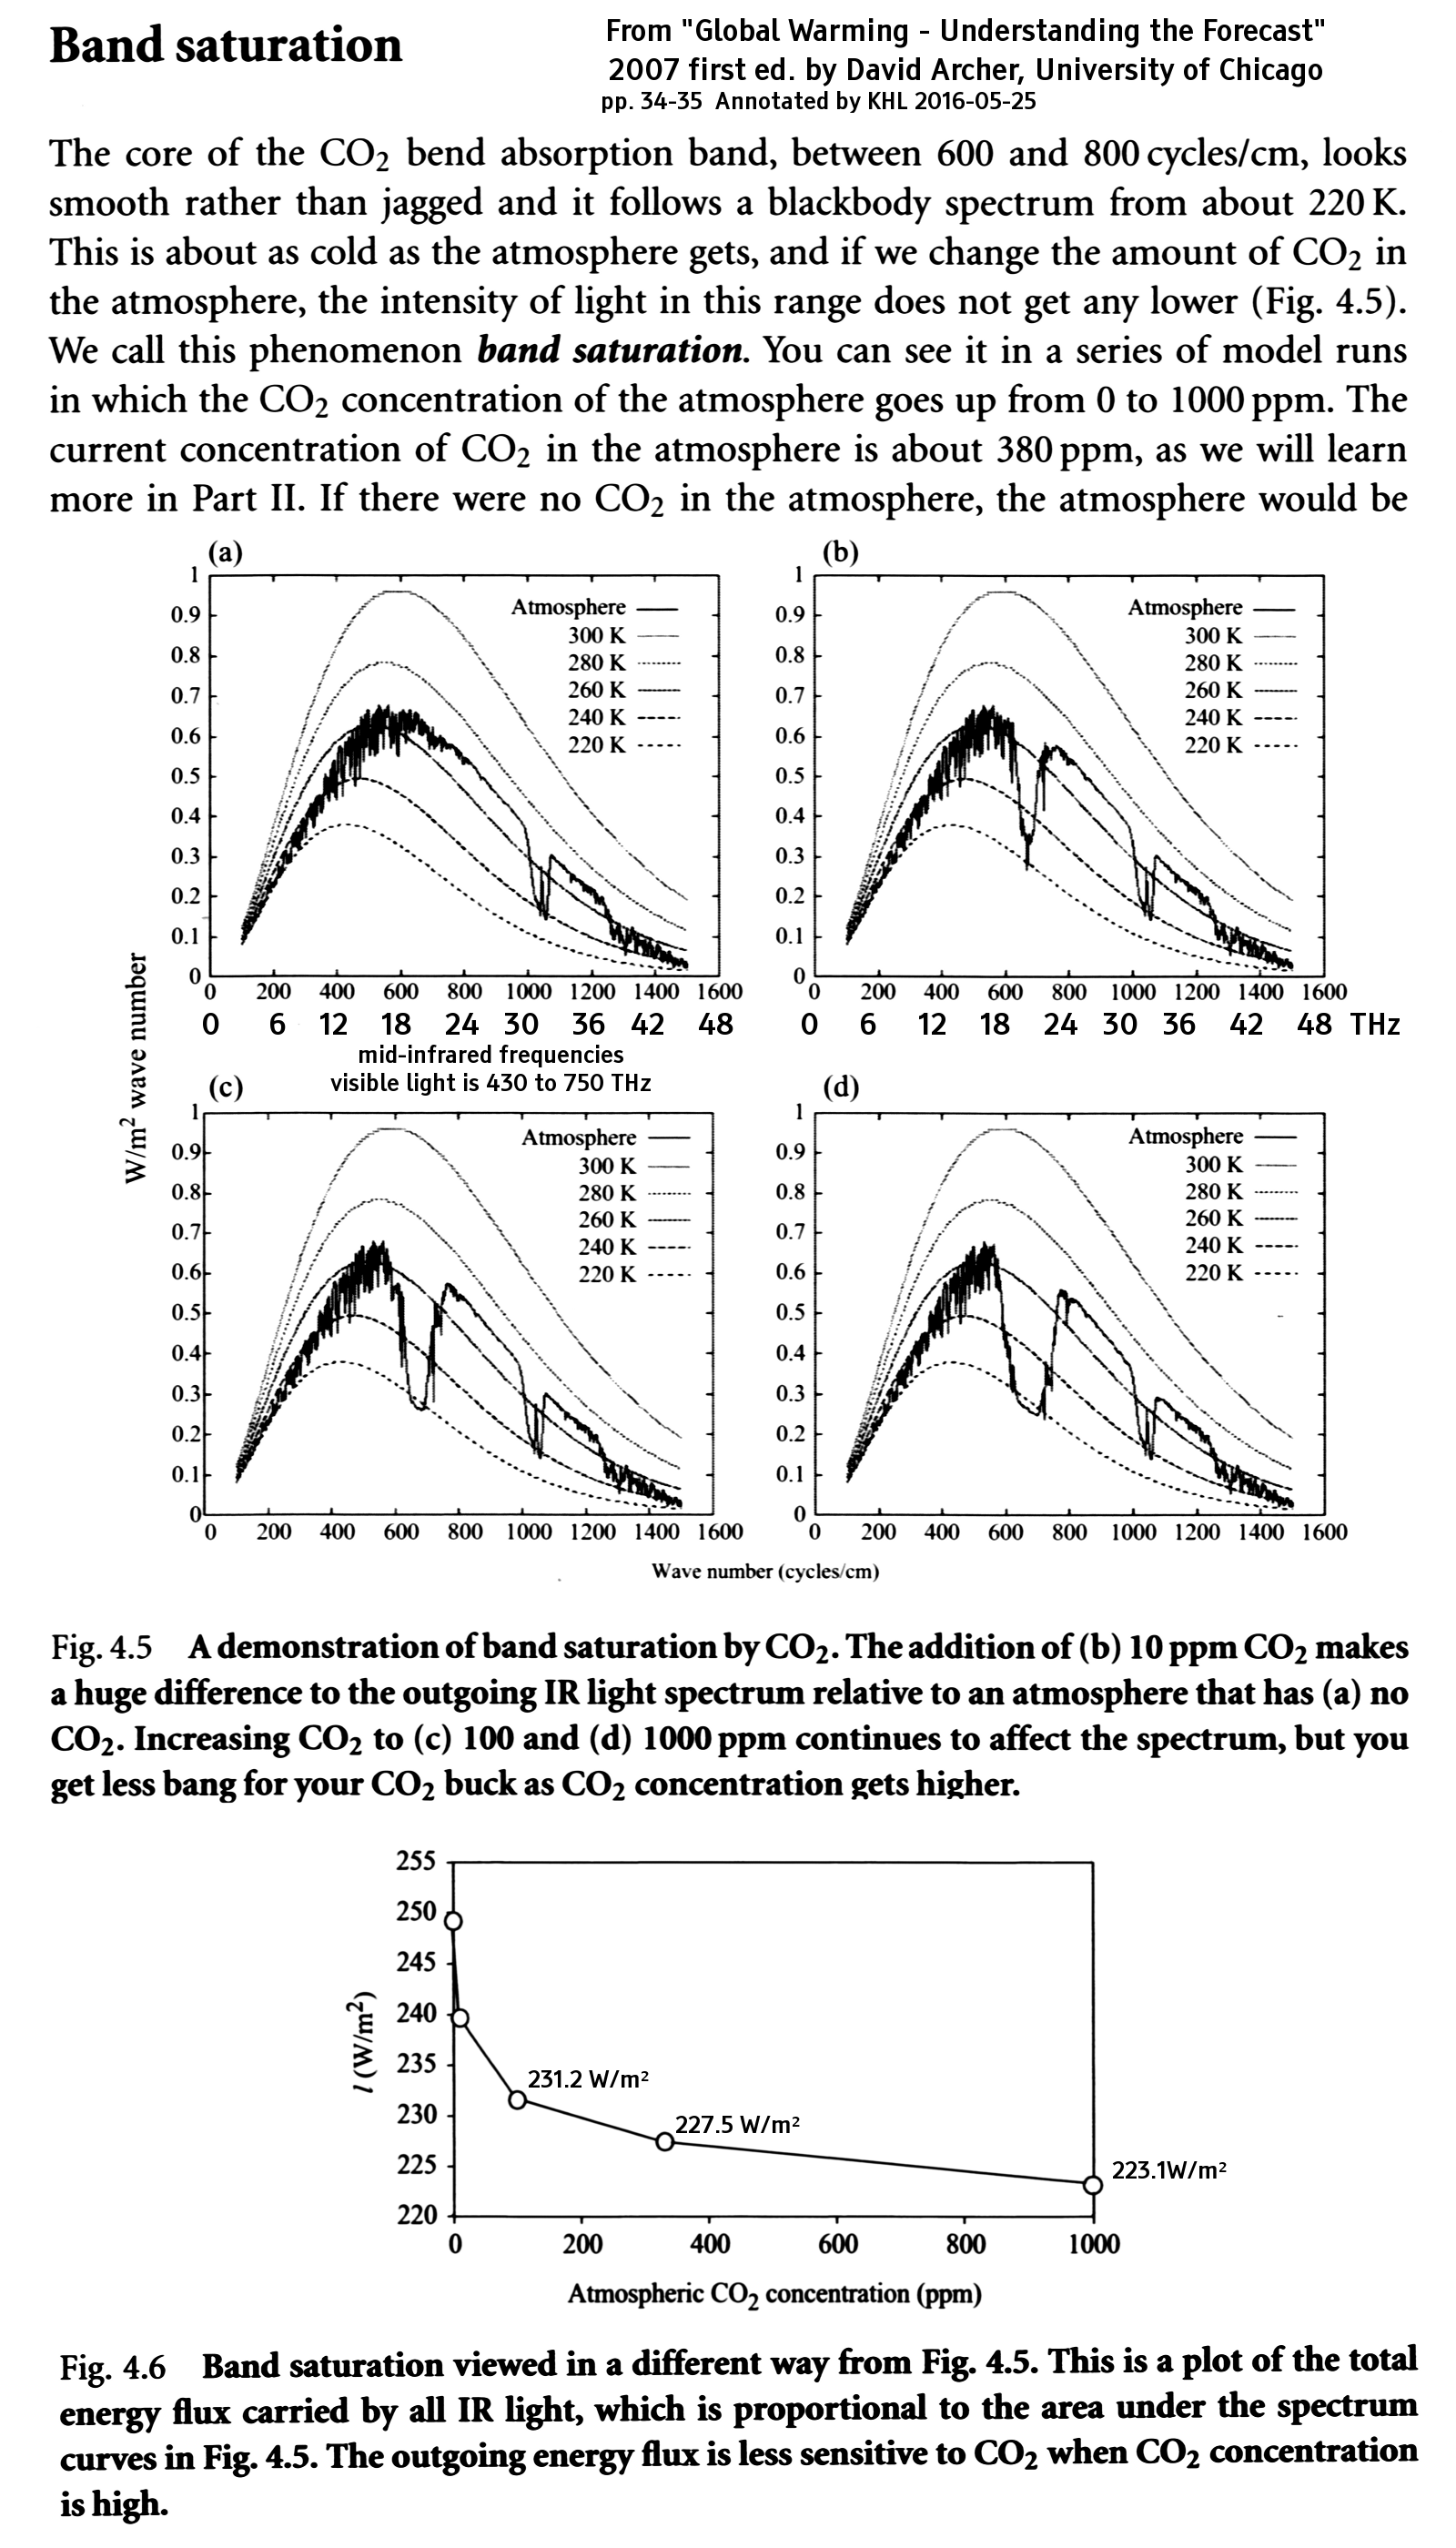
CO₂ Spectrum
From Global Warming, Understanding The Forecast by David Archer, Blackwell 2007, without permission. Buy the book for a lucid explanation of the science; perhaps the author and publisher might forgive me for posting the excerpt below.
I don't understand cycles/cm very well. The speed of light is 3e10 cm/s, so multiply 600 to 800 cycles/cm to get 18 to 24 THz.

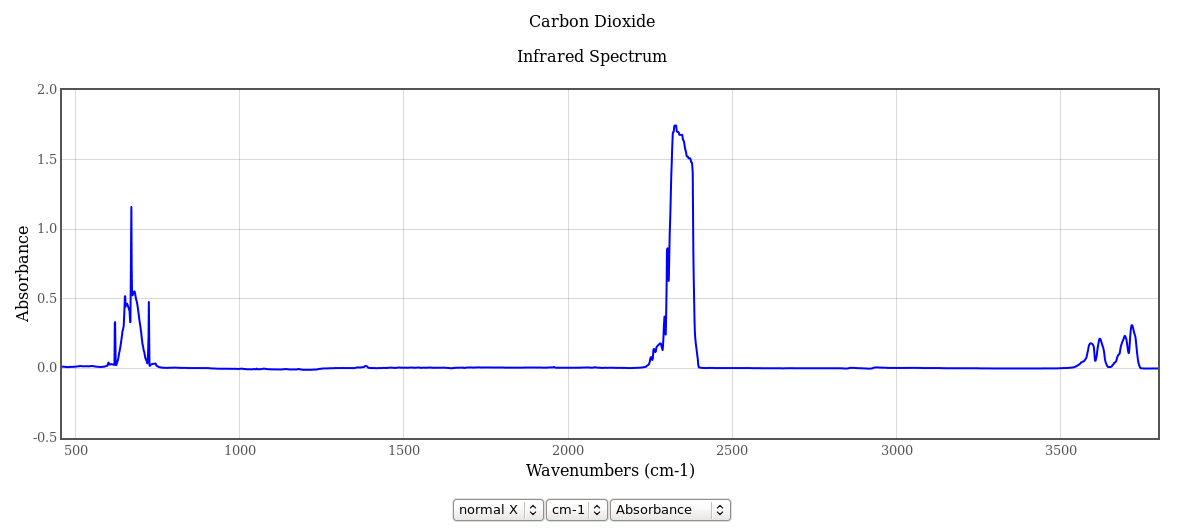
Here's the CO₂ absorption spectrum from NIST: ( http://webbook.nist.gov/cgi/cbook.cgi?ID=C124389&Type=IR-SPEC&Index=1#IR-SPEC )

This first graph shows absorptance out to 3700 cycles/cm ( about 110 THz ).
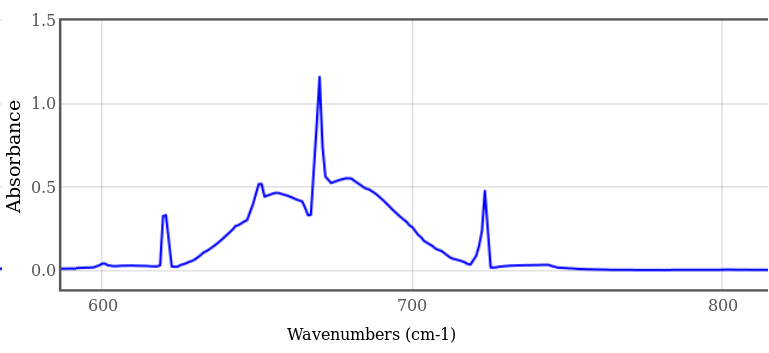
The strongest and broadest peak is at 2300 cycles/cm (about 70 THz), but this peak is irrelevant; The Earth is 220K to 300K (depending on where you look) so this is well above the earth's black body emission peaks (400 to 600 cycles/cm), in the quantum-limited exponential rolloff region. It is also well below the sun's black body emission peak of 11,300 cycles/cm at 5780 K. The peak that matters to us is within the 100 to 1500 cycles/cm window, shown below.

The interesting aspect of this peak is that it is broad, not sharp, with long tapering tails to the side. Frankly, I do not know what the vertical scale for this graph means, since absorption cannot be greater than one
